This site uses cookies that are essential for our site to work. We would also like to use non-essential cookies to help us improve your browsing experience and help make this website better, by collecting and reporting information on how you use our site.
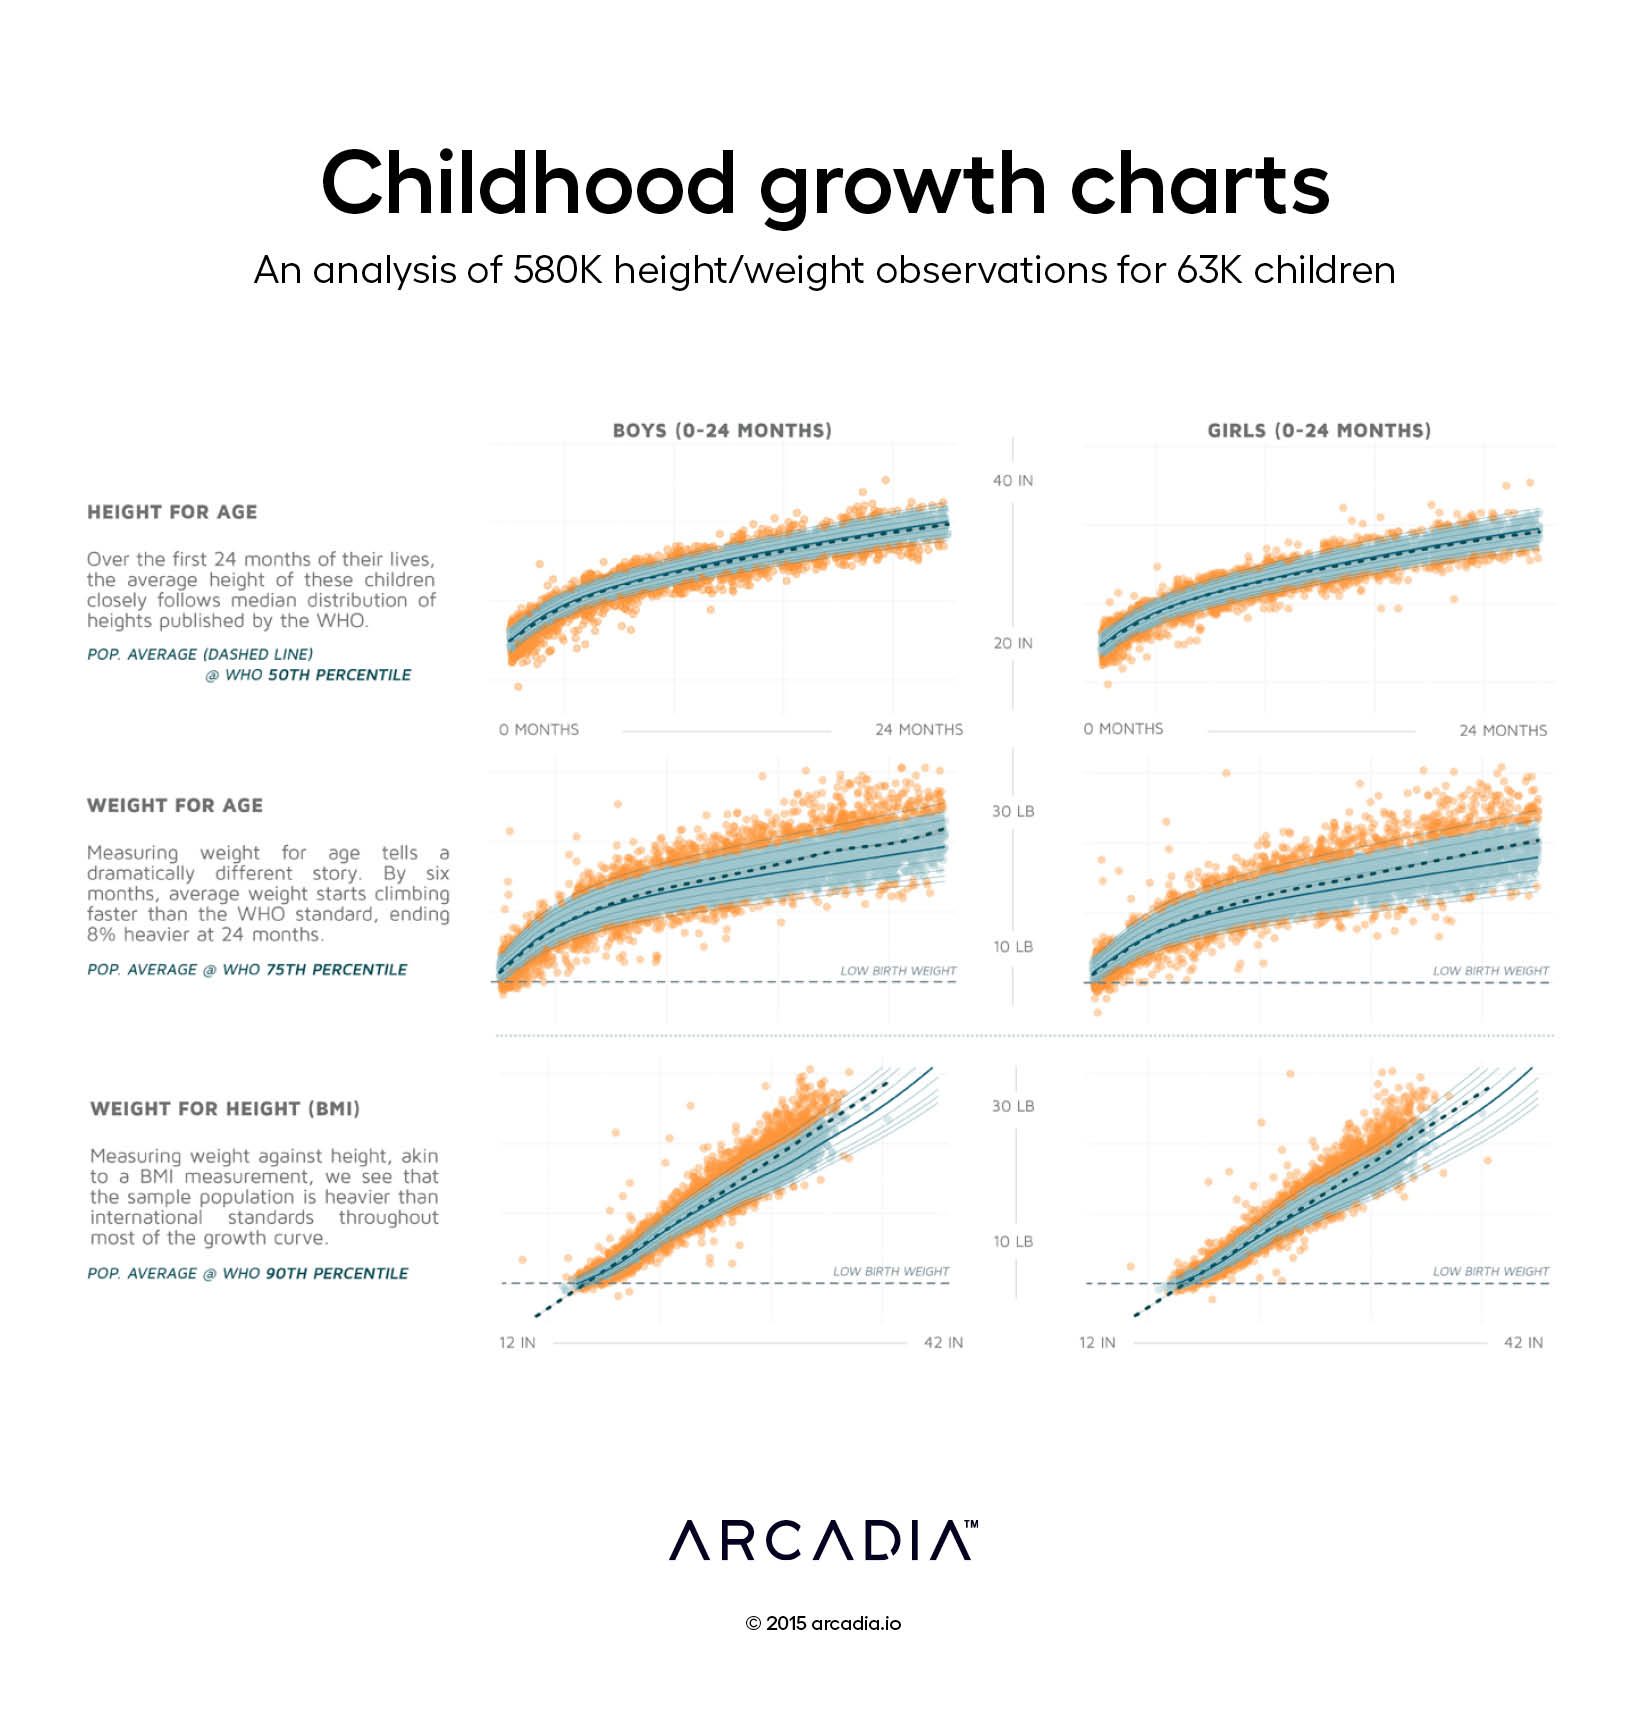
Since the 1970s, the World Health Organization (WHO) has published growth references detailing the growth of children, first from very specific European-derived populations, and later from a more global population, in their first 24 months of life. Most new parents will be quickly familiarized with the WHO Standard Growth Chart, and where on it their young children fall during this crucial period of growth.
The power of the WHO growth chart is amplified when considered on a broader population scale. In this visualization, a random sample of 10,000 age/height/weight tuples were drawn from a pool of 580,000 observations of 63,000 children. The WHO Growth Chart Standard is plotted in blue; the median is plotted in dark blue, with the 2.5th, 5th, 10th, 25th, 75th, 90th, 95th, and 97.5th percentile lines plotted in light blue. Children’s vitals are plotted in cyan, measurements outside the 5th or 95th percentiles are plotted in orange, and the population mean is plotted as a dark dashed line. A grey dashed line is drawn at 2.5kg, the standard for low birth weight.
This visual documents several important characteristics of this population. The children are generally of appropriate height for their age. However, population weight for height and age was high; children in this sample were on average 8% heavier than the WHO standard by 24 months. This information is reflective of the larger adult population from which this sample was drawn, suggesting an overall strategy that may place an emphasis on child health as part of an overall population health program.
Details
R, with Illustrator. 580,000 height/weight records mined from Arcadia Benchmark Database
This article covers insights from Episode 1 of the series, which features industry leaders Michael Meucci, CEO of Arcadia, and Albert Martinez, Chief Analytics Officer at Cleveland...
Arcadia’s Chief Product and Technology Officer, Nick Stepro, was recently named one of Modern Healthcare’s 2024 Innovators. The program recognizes leaders driving innovation that...
In this month’s Data Bytes, we’re digging deeper into healthcare data by exploring the data lakehouse. Read on to understand the basics of this data storage and retrieval architecture,...